
Snap Cart Drawer: Analytics
Analytics Overview
The Analytics dashboard helps you understand how customers interact with your cart drawer and measure its impact on your store's performance.
With Snap Cart Drawer Analytics, you can track key metrics such as revenue generated, customer engagement, conversion performance, and feature usage to optimize your cart experience.
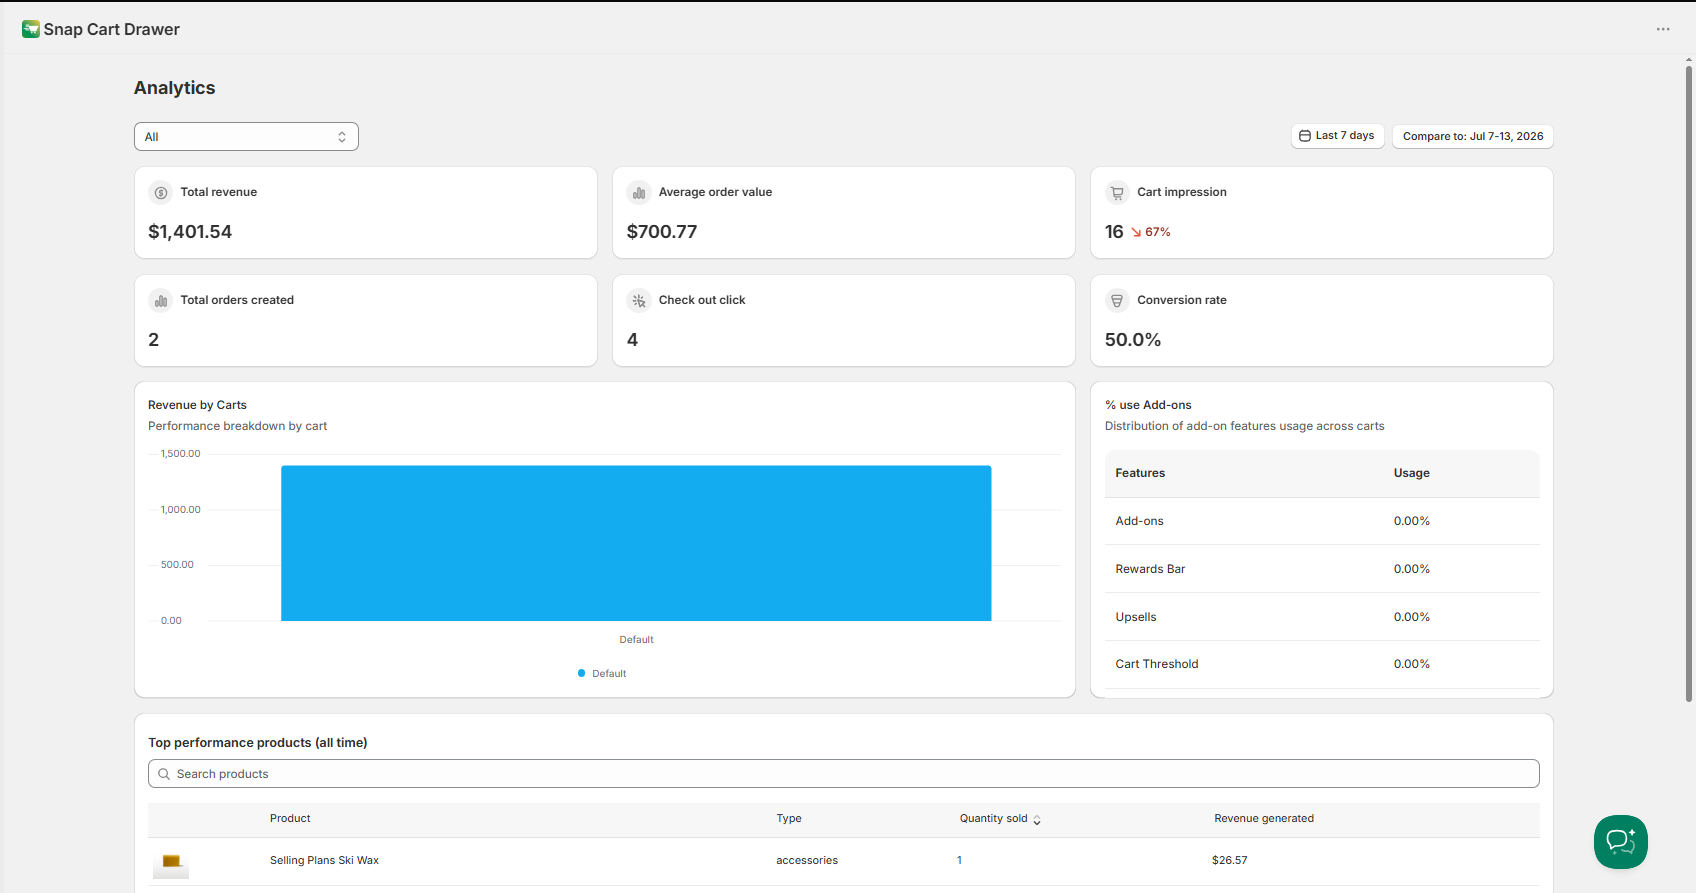
The analytics data allows you to:
- Monitor revenue generated by the cart drawer.
- Measure customer engagement with your cart.
- Track checkout performance and conversion rates.
- Compare the performance of different carts.
- Understand which products and features contribute most to sales.
Analytics Metrics
Total Revenue
Total Revenue represents the total amount of revenue generated through Snap Cart Drawer.
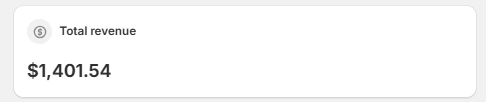
This metric helps you measure how much sales the app contributes to your store.
Average Order Value (AOV)
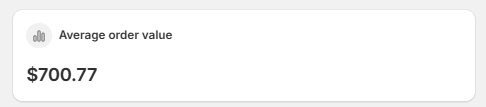
Average Order Value shows how much customers spend per order.
Formula
AOV = Total Revenue ÷ Total Orders Created
A higher AOV may indicate that customers are purchasing more products or responding well to features such as Upsell Products, Reward Progress Bar, and Order Add-ons.
Cart Impression
Cart Impression represents the number of times customers open the cart drawer.
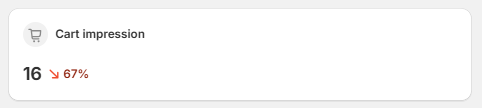
This metric helps you understand how frequently customers interact with your cart and can be useful when evaluating customer engagement.
Total Orders Created
Total Orders Created shows the total number of orders successfully created through the cart drawer.
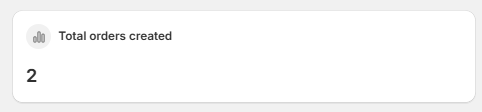
Tracking this metric alongside Total Revenue and Conversion Rate can help you measure your cart's overall performance.
Checkout Clicked
Checkout Clicked represents the total number of times customers click the checkout button in the cart drawer.

Comparing this metric with Total Orders Created can help you identify whether customers are completing their purchases after proceeding to checkout.
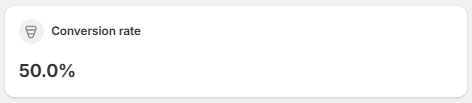
Conversion Rate
Conversion Rate measures how effectively your cart drawer converts customer intent into completed orders.
Formula
Conversion Rate = Total Orders Created ÷ Checkout Clicked
A higher conversion rate generally indicates that customers are successfully completing their purchases after clicking the checkout button.
Cart Performance
Revenue by Carts
Revenue by Carts provides a performance breakdown for each cart created in Snap Cart Drawer.
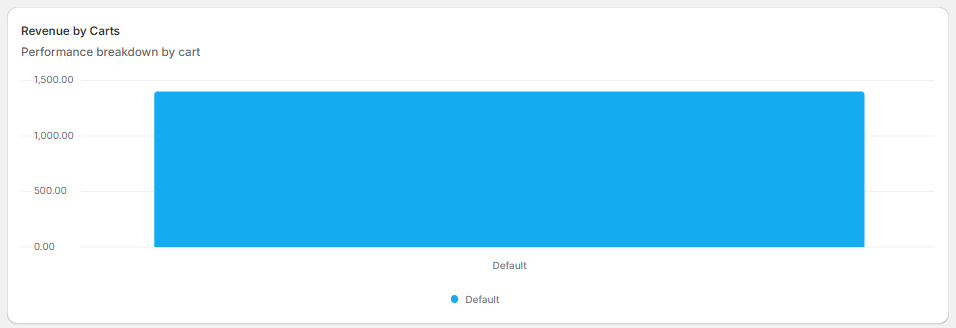
This report helps you compare how different carts perform across your store and identify which cart generates the most revenue.
It can be especially useful when using Multiple Carts for different markets or customer segments.
% Use Add-ons
The % Use Add-ons report shows the distribution of feature usage across your carts.
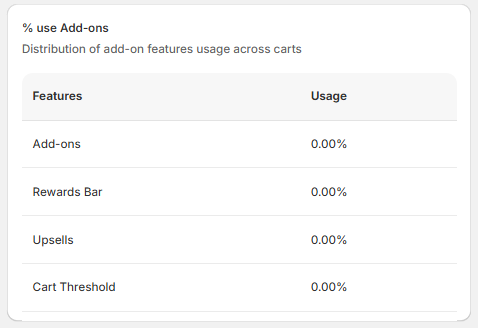
Depending on the features enabled in your cart, this report may include:
- Order Add-ons
- Reward Progress Bar
- Upsell Products
- Other supported add-on features
Monitoring feature adoption can help you understand which revenue-boosting components are most effective for your customers.
Product Performance
Top Performance Products (All Time)
This section displays the products that have generated the best performance through Snap Cart Drawer.
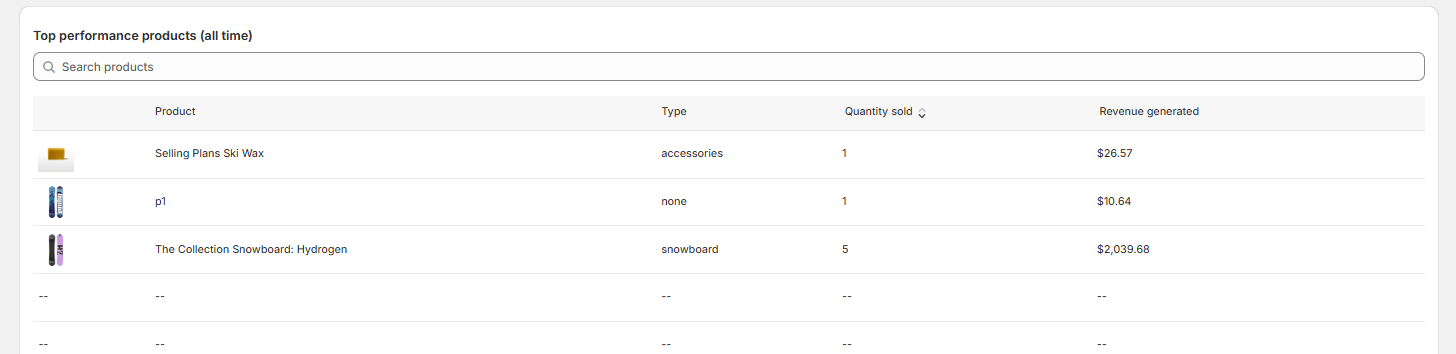
The report includes:
- Product name
- Product type
- Quantity sold
- Revenue generated
By reviewing your top-performing products, you can identify which items contribute most to your revenue and use this information to improve your upsell strategies and cart experience.
Next Steps
Use the Analytics dashboard regularly to monitor your cart's performance and optimize your customers' shopping experience. Combining analytics data with features such as Upsell Products, Reward Progress Bar, and Order Add-ons can help you improve both conversion rates and average order value over time.